
Sparkline
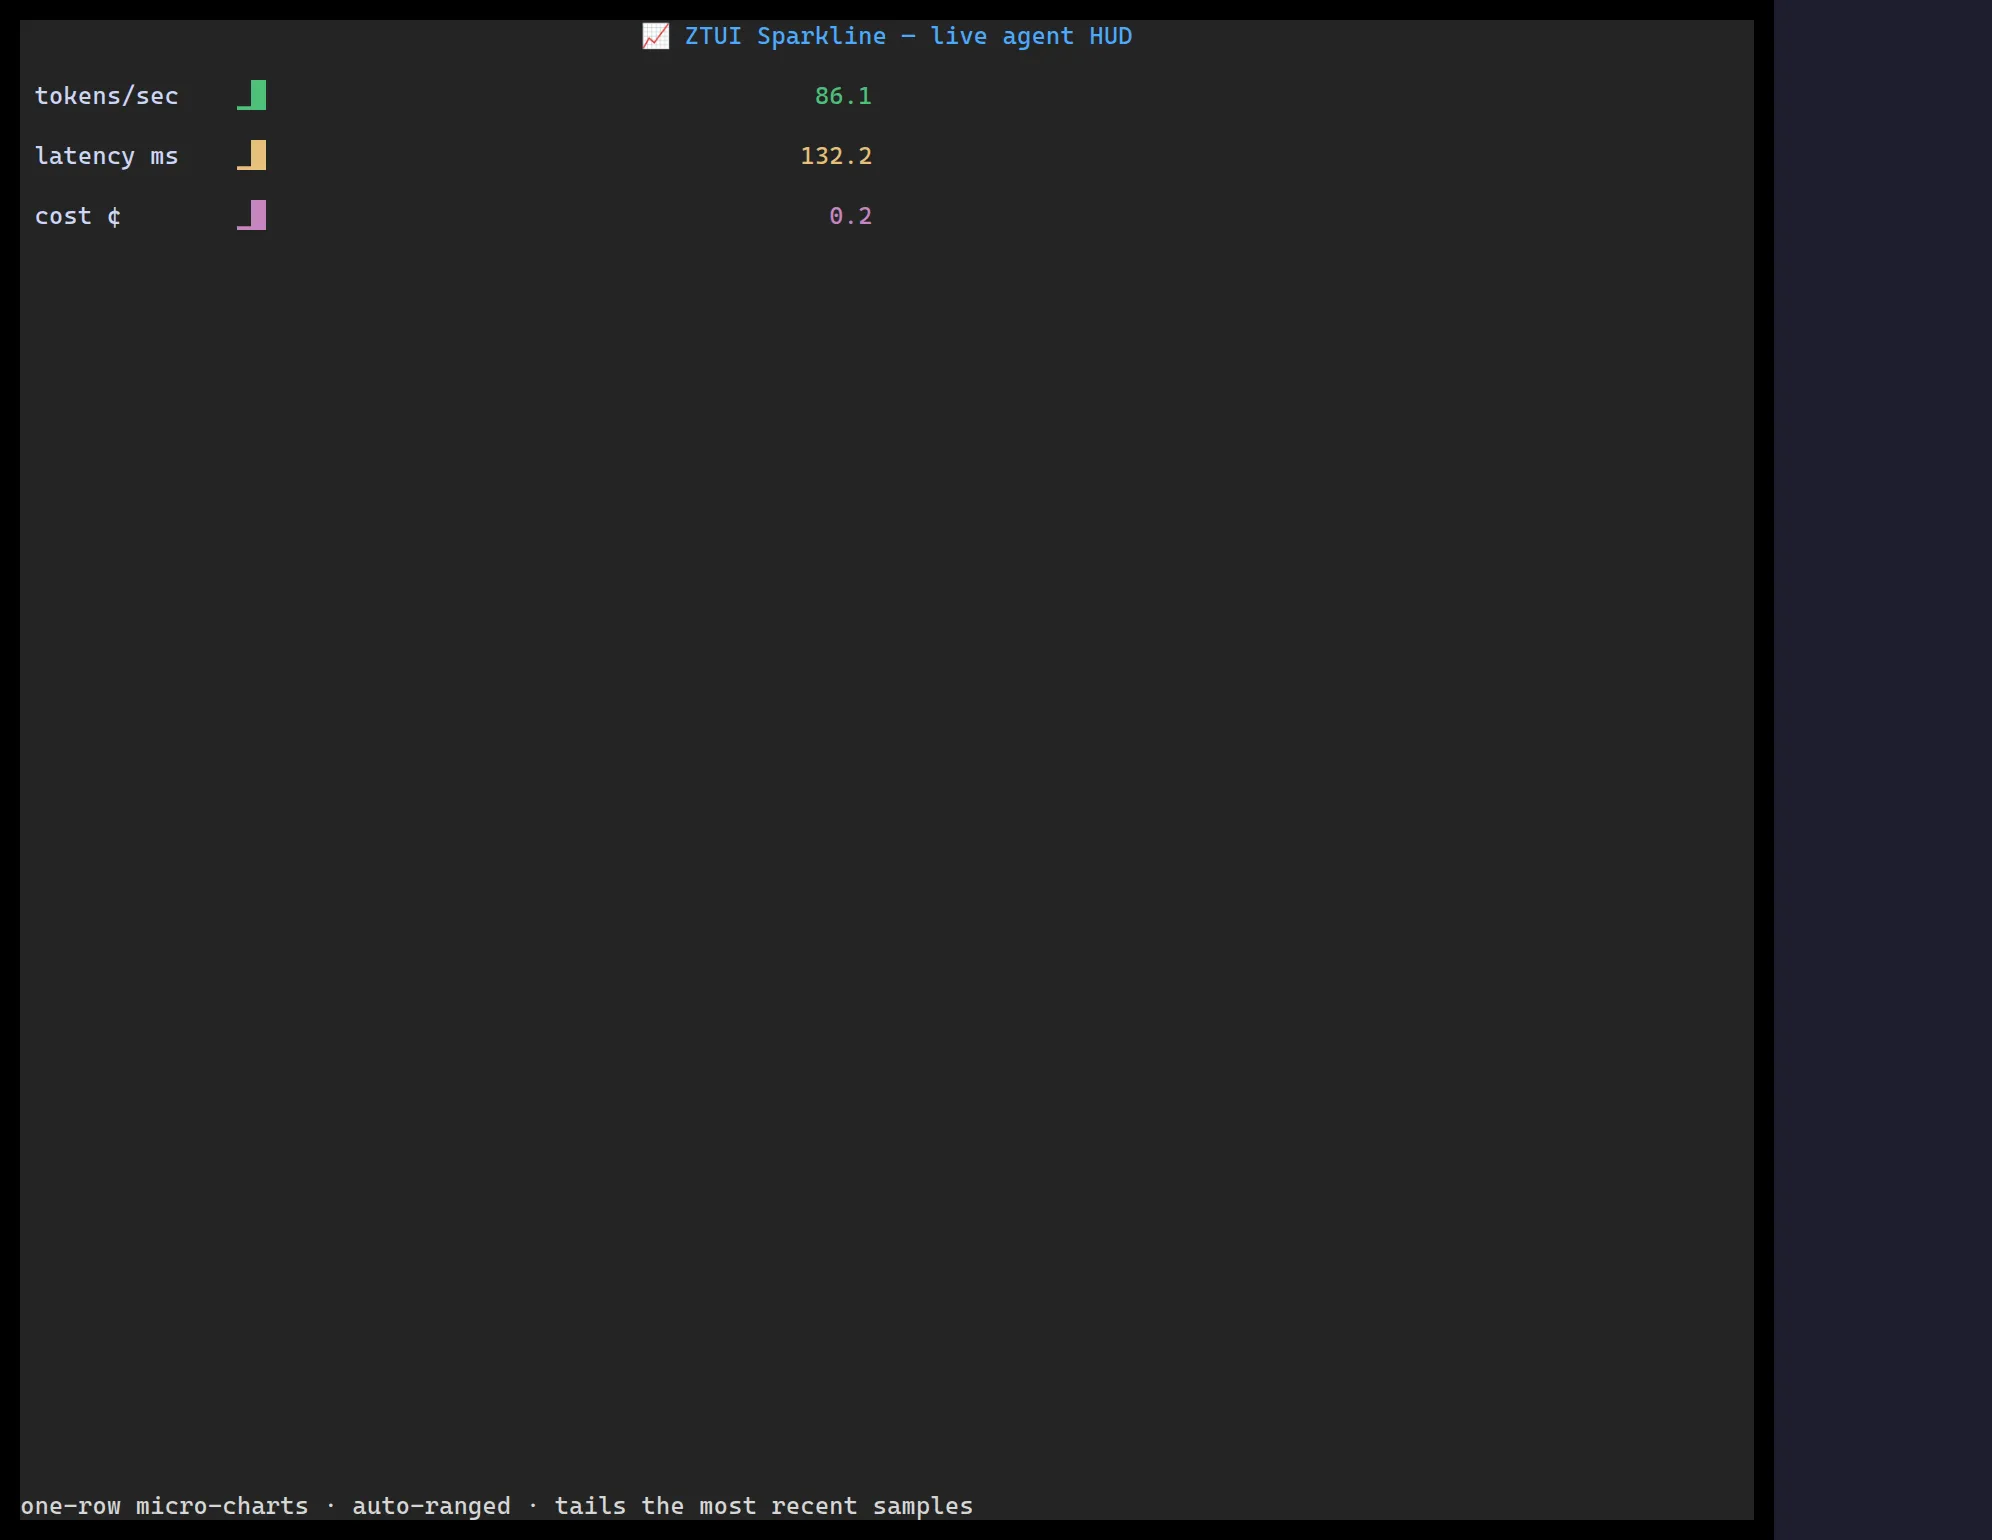
<Sparkline> turns a numeric series into a one-line (or multi-row) trend chart
using partial-block glyphs — ideal for dashboards and status bars.
import { Sparkline } from "@huyz0/ztui/react";
<Sparkline  data={[3, 7, 4, 9, 12, 8, 15, 11, 6]}  showValue  style={{ width: 40, color: "$success" }}/>;
Key props
Section titled “Key props”data—number[], the series to plot.min/max— fix the value range (defaults to the data’s own range).showValue— append the latest value as text.