
DevTools
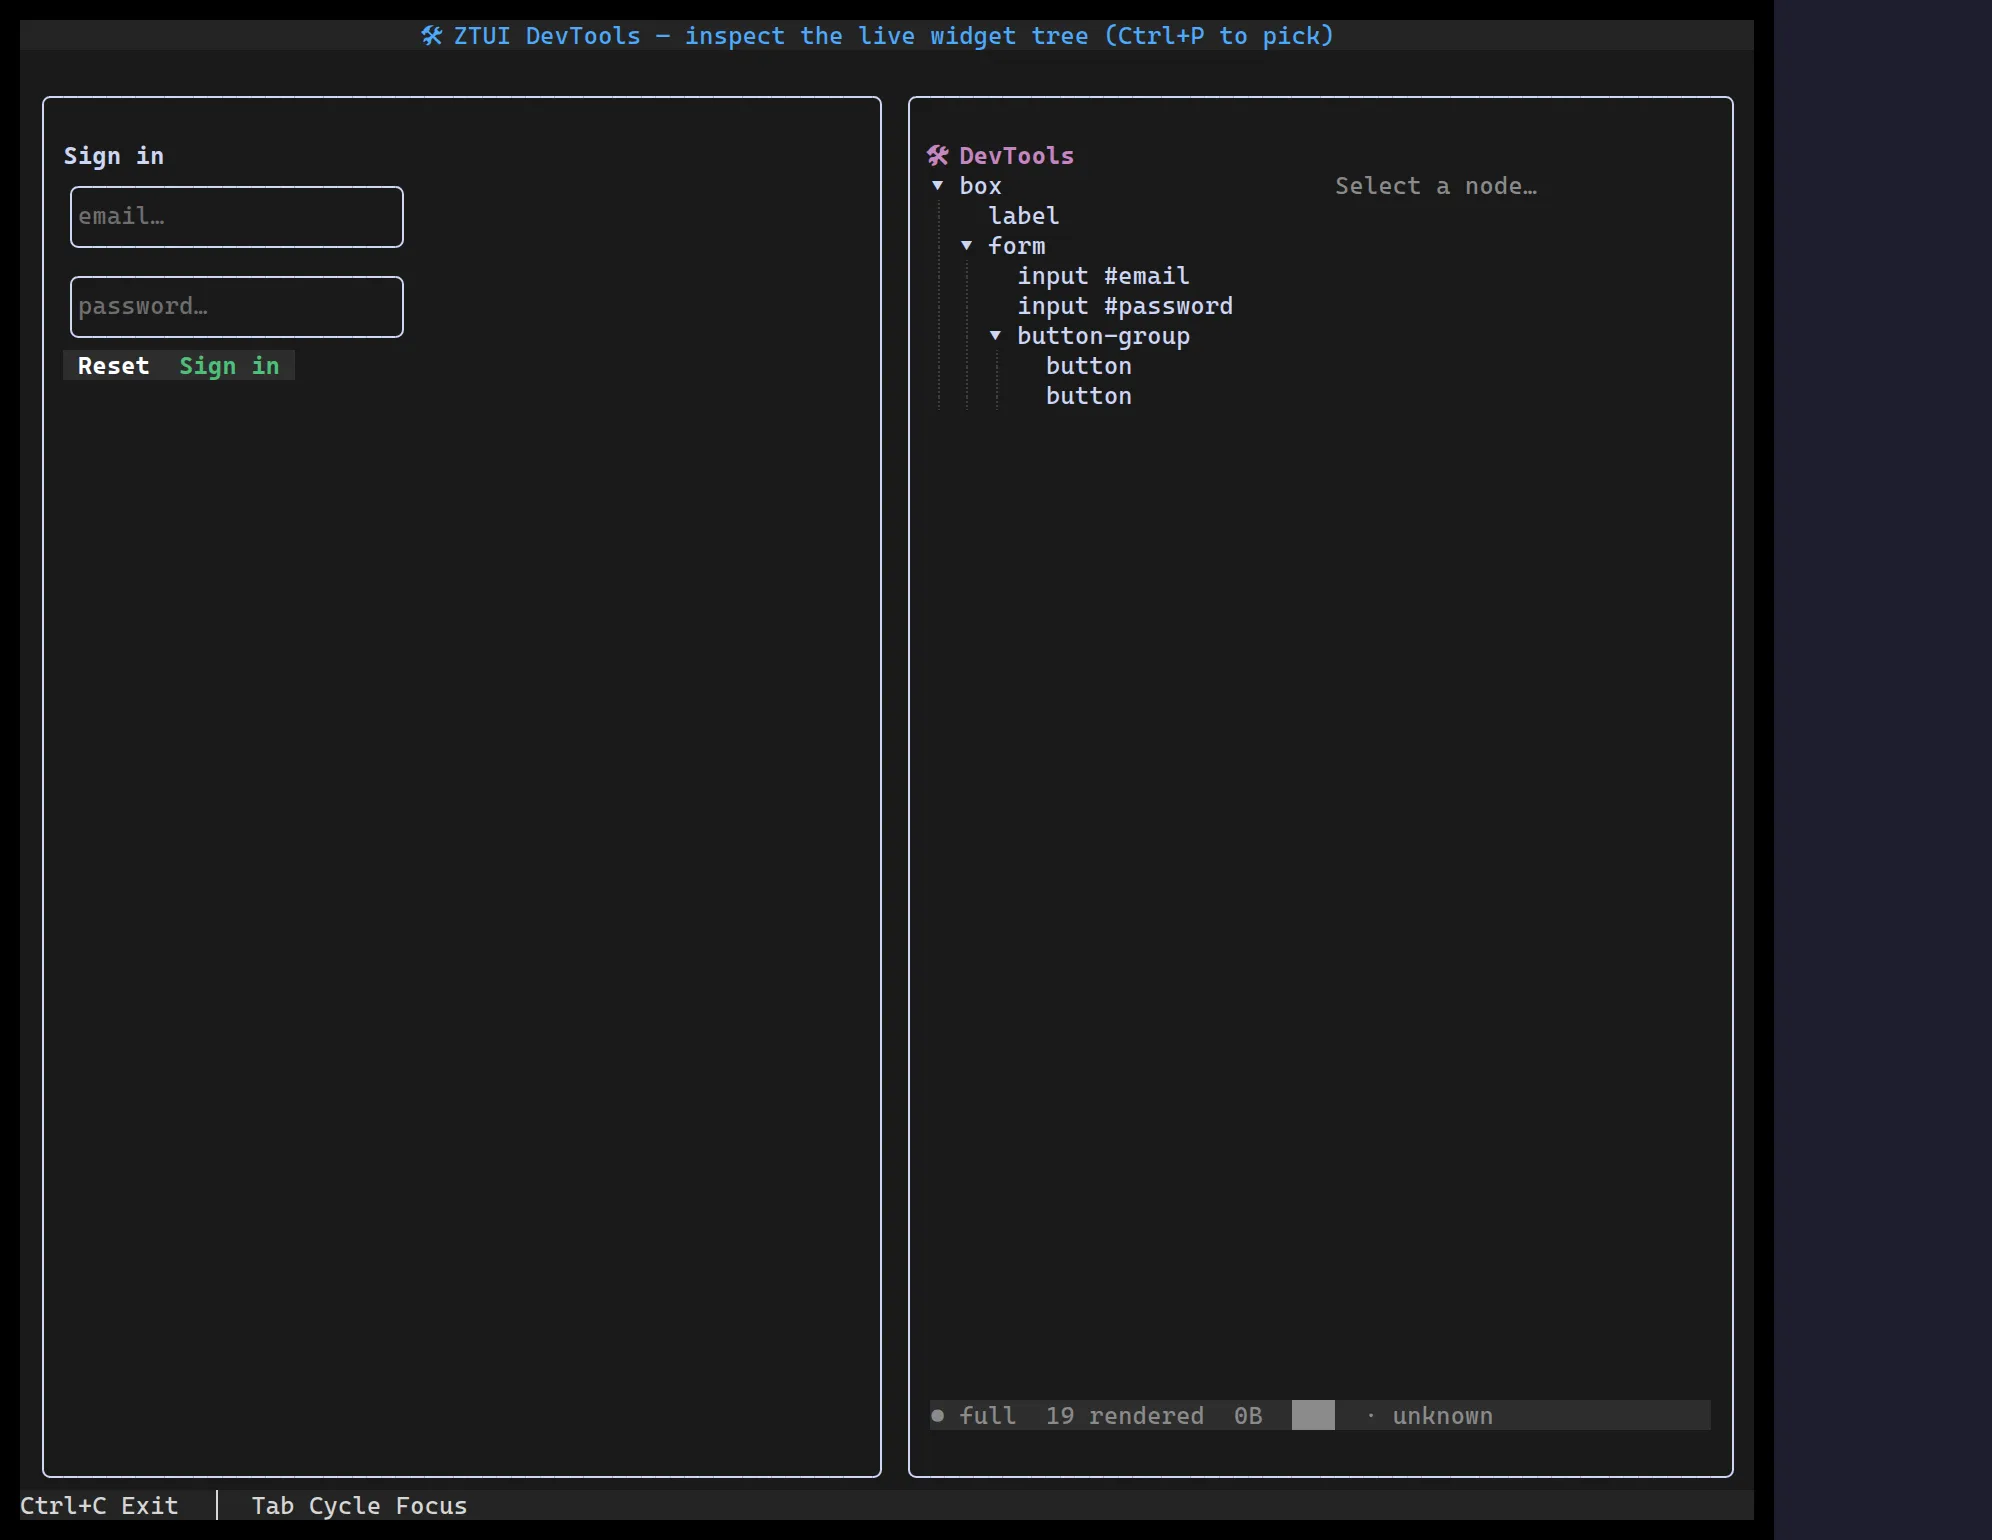
<DevTools> is an in-app inspector — a React-DevTools analogue for ztui. The
left pane is the live widget tree (tag #id .class); selecting a node shows
its geometry, flags, and resolved style on the right and highlights it on
screen with a <DevToolsHighlight> overlay (a pointer-transparent, full-screen
overlay that tints the widget’s cells — it keeps their glyphs and can’t land in
the wrong place); the footer is a one-line render
profiler (scoped vs full frame, widgets rendered, bytes emitted, and the
reasons the last frame ran). In pick mode (pick), hovering the app selects
the widget under the pointer — point at the UI to inspect it. Read-only.
Point it at a different subtree than itself — pass the inspected app’s root
via a ref — so it doesn’t inspect its own widgets:
import { useEffect, useRef, useState } from "react";import { App, type Widget } from "@huyz0/ztui";import { DevTools, type DevToolsFrame } from "@huyz0/ztui/react";
function WithDevTools() {  const inspected = useRef<Widget>(null);  const [frame, setFrame] = useState<DevToolsFrame | null>(null);  useEffect(() => {    const h = setInterval(() => setFrame(App.instance?.getLastFrame() ?? null), 400);    return () => clearInterval(h);  }, []);
  return (    <HBox>      <VBox ref={inspected} style={{ width: "1fr" }}>{/* your app */}</VBox>      <DevTools root={inspected.current} frame={frame} style={{ width: "1fr" }} />    </HBox>  );}
Key props
Section titled “Key props”root— the widget to inspect (the inspected app’s container, or the screen).frame— the latestApp.getLastFrame()summary; drives the profiler strip (full,widgetsRendered,bytes,reasons).refreshMs— how often to re-read the live (mutating) tree. Default400.pick— pick mode: trackApp.instance.hoveredWidgetand select it (hover the app to inspect). Off by default.onInspect(region | null)— fired when the selection changes, with its screen rect; render a<DevToolsHighlight region={…} />(under a full-screen root, so it isn’t clipped to a panel) to draw the highlight box over the widget.
Data layer
Section titled “Data layer”The panel is built on a small in-process data layer you can use directly (e.g. to build your own inspector or a remote panel):
serializeDevTree(root)→ aTree-compatibleDevToolsNode(path ids, text nodes omitted).resolveDevNode(root, id)→ the live node for a tree id.widgetDetail(node)→{ term, description }[]of identity, geometry, flags, and resolved style.
This complements the HTTP startInspector() backend (/tree, /dom, /state,
/render, /screenshot).
Browser panel
Section titled “Browser panel”startInspector(app) also serves a browser DevTools panel at
GET /devtools — open it in any browser pointed at the inspector:
import { startInspector } from "@huyz0/ztui";
const server = startInspector(app); // http://127.0.0.1:8000// → open http://127.0.0.1:8000/devtools
It’s a self-contained page (no build step) that polls /render, /dom, and
/state and shows a live screen mirror, the interactive widget tree, a
per-node detail pane, and a profiler header — the latest frame
(#seq full|scoped Nw bytes), a sparkline of recent frames’ widget-render
counts, focus/hover/theme, and the top render reasons. Clicking a node boxes it
on the mirror. Toggle ⚡ highlight updates to flash the damaged row band on
each scoped frame — the terminal analogue of React DevTools’ “highlight updates”
(it visualises exactly which rows a repaint touched).
The inspector binds to loopback by default — it has no auth and POST /input
can drive the app, so only expose it on a trusted network.